AL Reports Don’t Have to Be Painful – 10 Tips & Tricks That Save Time (and Sanity)
If you’ve ever developed reports in AL, you know exactly what I mean.
Reports are powerful. They are flexible. And sometimes… they are just painful 😄.
Back in 2020, I wrote a blog post called “9 Tips for Developing Reports in AL”. A lot of those tips are still valid today — but what has changed massively is the tooling around AL development.
Reports didn’t magically become easier. But with the right tools, they definitely became less painful.
In this post, I’m sharing 10 practical tips & tricks that help me save time (and sanity) when developing AL reports in 2025 — especially when using AL Navigator, AL Advanced Tools Suite, AL Variable Helper, AL Toolbox and NAB AL Tools.
No theory. No buzzwords. Just things that actually help.
1️⃣ Plan the Report Before Writing Code
I know this sounds boring — but skipping this step always costs more time later.
Before opening VS Code, quickly think about:
- Am I creating a new report or customizing an existing one?
- Which tables do I really need?
- How should the dataset roughly look?
You don’t need fancy diagrams. A rough mental plan is usually enough.
2️⃣ Copy an Existing Report Instead of Starting from Scratch
In real-world projects, most reports are based on standard objects. You don’t often want to start from scratch. Instead, you want to copy an existing report or create a report extension based on an existing report.
AL Navigator makes this extremely easy:
- Copy reports directly from the app file
- Automatically extract the AL file and the layout (RDLC or Word)
No manual copying. No broken layout references. You immediately get a clean, working starting point.
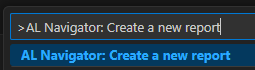
Use the command: “AL Navigator: Create a new report”
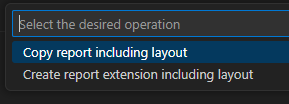
Select if you want a report extension or a report:
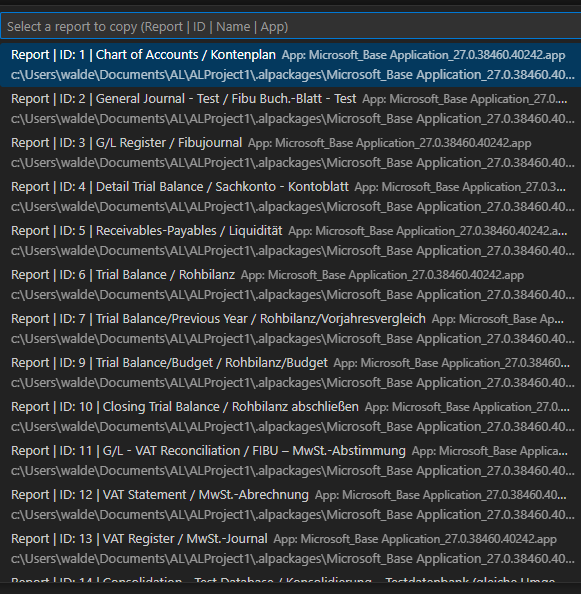
You will be presented with a list of all reports that you can copy including a translation of the report to make it easier to find the right one.
Select the report that you want to copy.
Select a name:
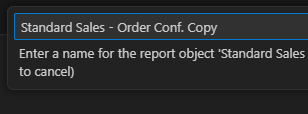
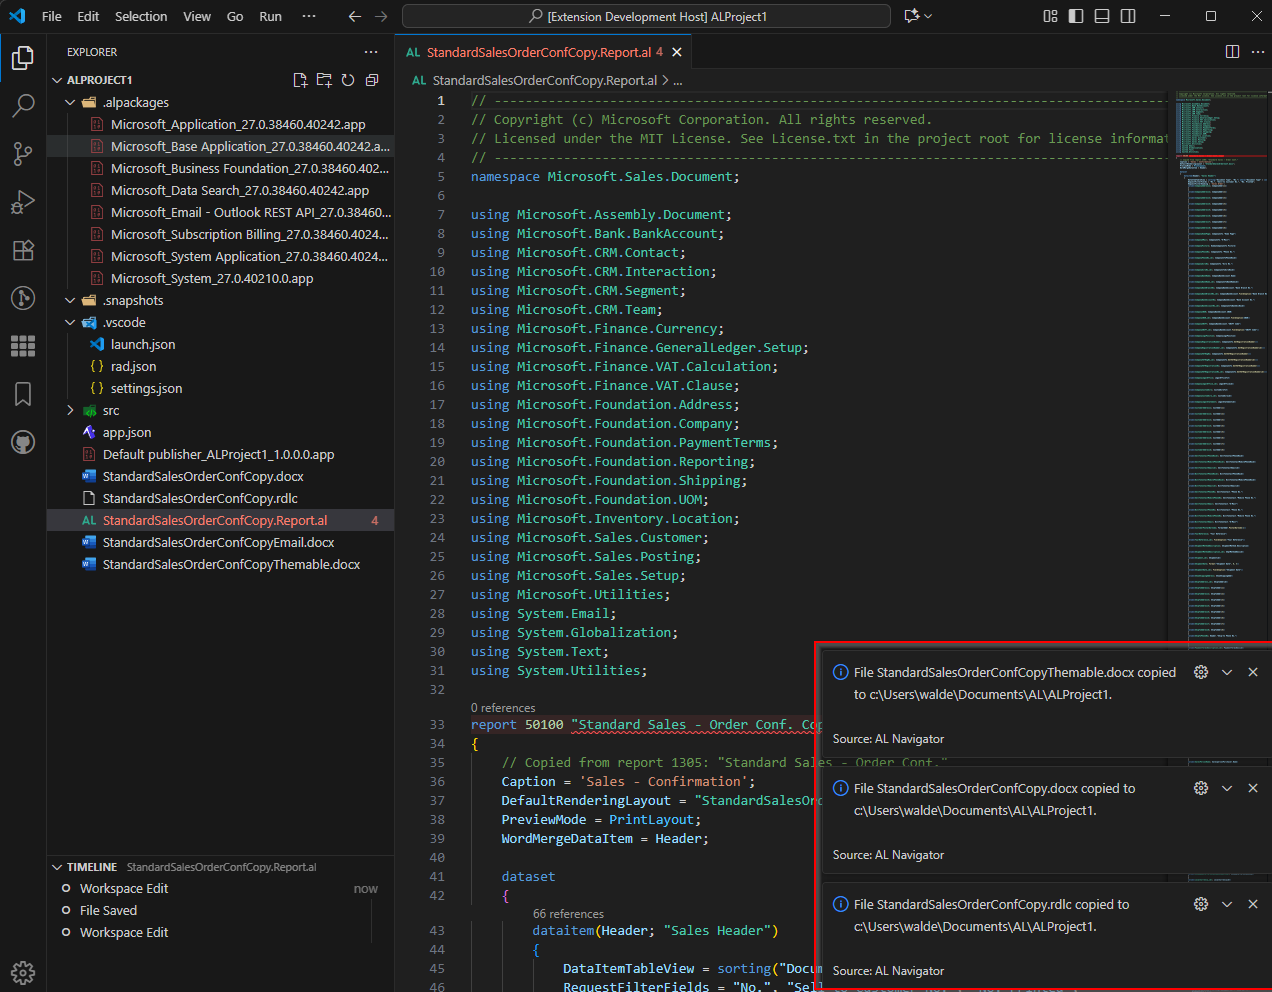
The report will be copied including all layouts to your workspace. If you have a report and/or layout folder, the report or layout will be copied to these folders.
3️⃣ Update Your Startup Object Id and Startup Object Type
Updating your launch.json startup object manually is always a pain in the ass.
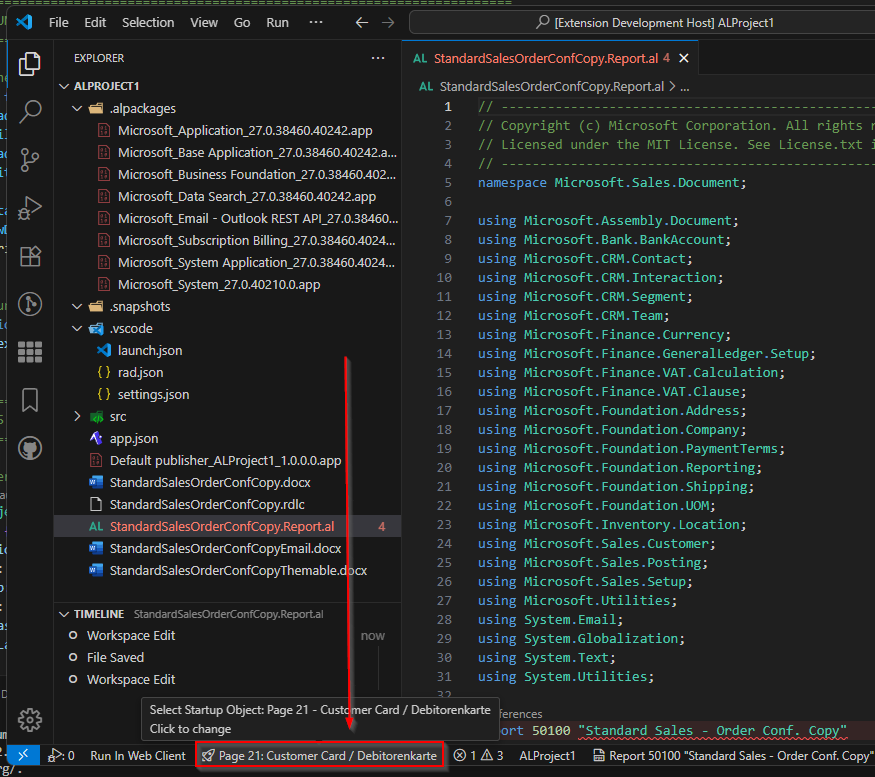
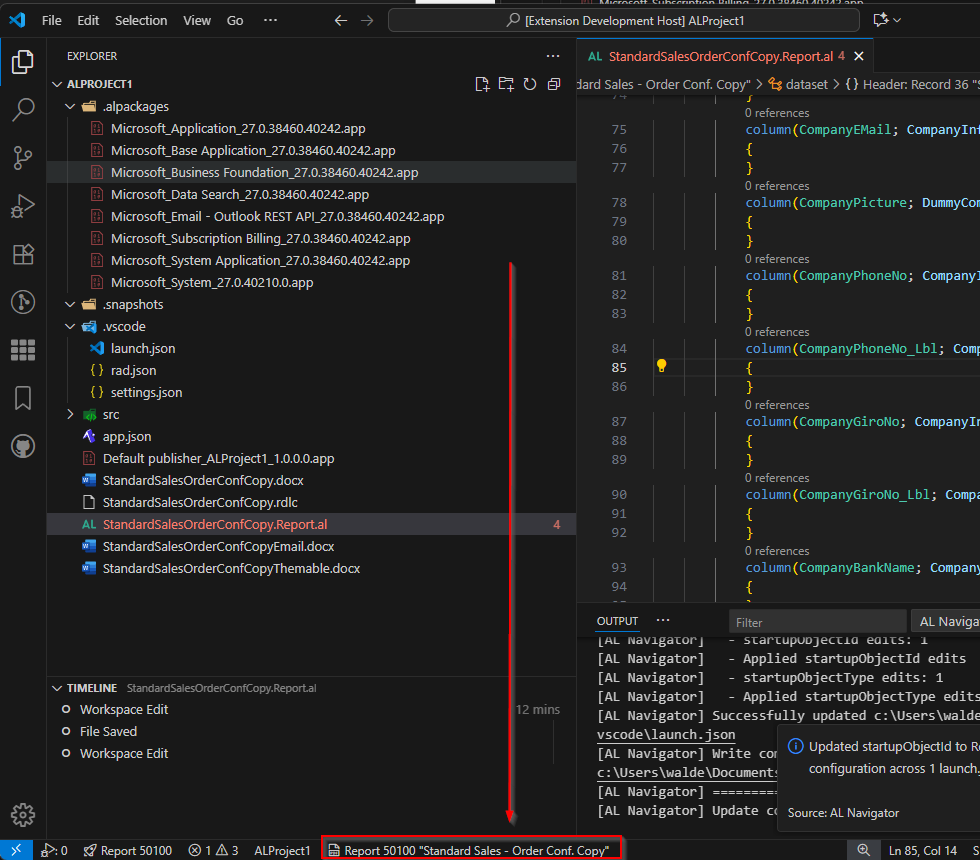
You can let AL Navigator update your launch.json startup object by simply opening the report AL file and using the launch.json status bar. Click on the icon on the bottom of your vs code window:
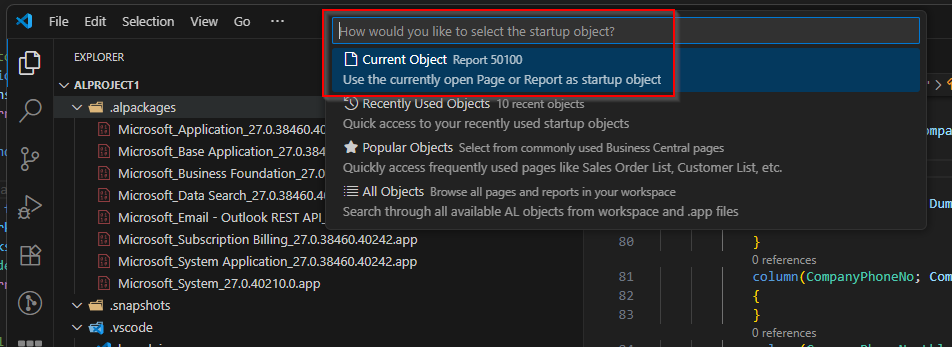
This will prompt a dialog where you can select the current object to be the startup object.
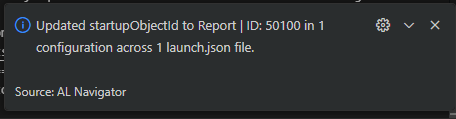
Set this up once — and forget about it.
You can read more about the functionality in my blog post Speed Up Your Business Central Development: Quick Startup Object Selection (launch.json).
4️⃣ Navigate Large Reports Without Losing Your Mind
Reports get big. Very big. So learn how to navigate them efficiently if you want to keep sane. This sounds like a small thing — but it completely changes how it feels to work with reports unless you love to scroll like an idiot.
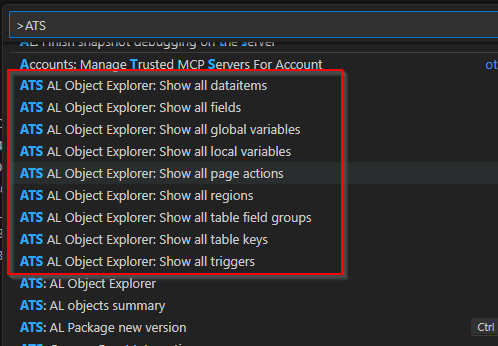
4.1 Use The AL Object Info of AL Advanced Tools Suite to Get An Overview of Your Report
Click the icon “AL Object Info” to get details about the report.
Clicking on the various options opens the details and let’s you navigate directly to these parts of the object. This is extremely helpful for large report objects.
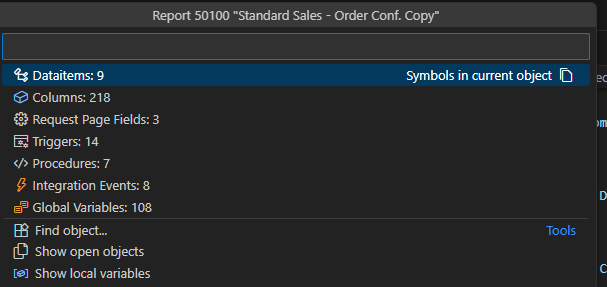
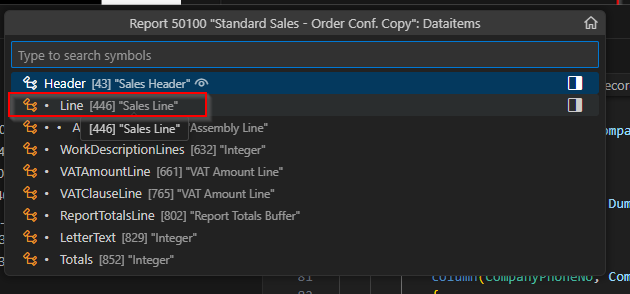
For example, by clicking dataitems you can see all the data items and by clicking on a specific data item you will jump the the line in the code.
There is also the option to use the corresponding commands if you do not want to click too much:
4.2 Jump To The Start Of Your Global Variables With Ctrl + G
If you have a report with more than 1000 lines, you may not always want to scroll to your global variables. Use Rasmus Aaen’s Variable Helper to jump to the beginning of your global variables.
The command “AL-Var: Global Variables” (Ctrl + G) is a real time saver…

…and gets you over here real quick:

4.3 Jump To The End Of Your Global Variables With Ctrl + Alt+ G
If you have many variables in your report, it might not be enough to jump to the beginning of these variables. Use my extension AL Navigator to jump to the end of your variables.
The extension provides a command “AL: Navigator: Last global var line” (Ctrl + Alt + G).

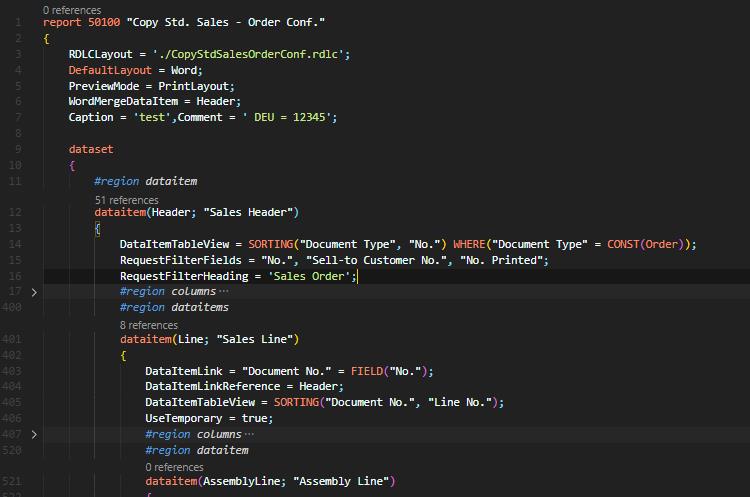
4.4 Jump To The Start/End Of Your DataItem With Ctrl + Shift + ^
This one will be new for some people. With the command “Go to Bracket” (Ctrl + Shift + ^) you can comfortably jump either to the end or start of an indentation or bracket.

For example, if you stand in the beginning bracket of your DataItem (line 13) and execute the command, your cursor will be moved to the end of the DataItem – where the triggers are located. Cool shit, right?

4.5 Jump Through Your DataItems With Ctrl + Alt + D Or Shift + Alt + D
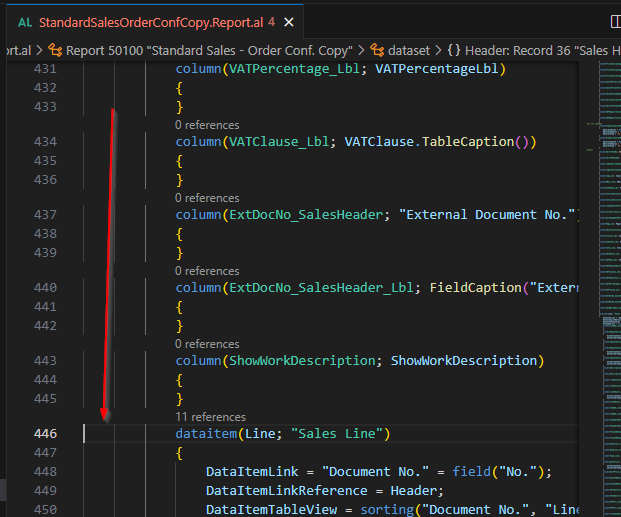
AL Navigator offers other functionalities. Use the commands “AL Navigator: Next DataItem (starting from bottom)” (Shift + Alt + D) or “AL Navigator: Next DataItem (starting from top)” (Ctrl + Alt + D) to “jump” through your DataItems.

With each call of the command the cursor jumps to the next DataItem:

4.6 Navigate Through Your Symbols with Ctrl + Shift + O
Reports can have a high complexity. The standard “Sales – Order Conf.” (Report 1305) in Business Central has 5 DataItems. This makes it difficult to navigate through the different DataItems, triggers and other code locations.
Therefore, it is advisable to use the command “Go to Symbol in Editor…”. (Ctrl + Shift + O). The command shows you a list of your symbols and allows you to search the symbols.

For example, you can search for “@onafter” and quickly jump to your OnAfterGetRecord triggers.

You can quickly jump to your request page with the search term “@req”.

…or even search for the individual fields in your request page.

5️⃣ Understand the Existing Logic Before Changing It
This is especially important when you copy standard reports.
AL Advanced Tools Suite allows you to:
- Show all triggers of a report
- Visualize region structures
- Understand grouping and calculation logic faster
Spending a few minutes understanding the existing logic often saves hours of debugging later.
6️⃣ Stop Fighting with Variables
Manual variable handling in reports is error-prone.
AL Navigator helps by:
- Creating variables in the correct section
- Keeping naming consistent
- Synchronizing dataset field names with the layout
Less friction. Fewer mistakes. Cleaner code.
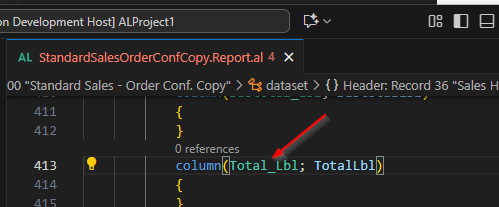
6.1 Add New Variables With The Quick Fix Lamp (Ctrl + .)
Sometimes you just want to pass a new variable as column in the dataset. You can use the CodeAction “Add global Variable” of the AL Navigator to create the new variable from the column. Pretty comfortable, isn’t it? 😉

Of course this CodeAction also works in functions and triggers, as you can see below. In the following gif I am standing in the OnInitReport-Trigger and create a global record “Company Information” from there.

6.2 Rename existing variables
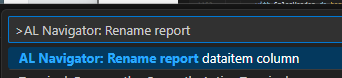
If you rename variables in AL that are also used in RDL(C), the variables in RDL(C) will not be automatically updated. AL Navigator helps you out. Place your cursor on the variable that you want to rename and use the command “AL Navigator: Rename report dataitem column“:
Choose the new name of the variable:
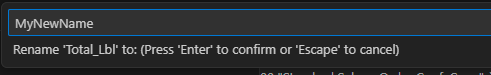
This will update the variable in the RDL(C) layout and in the AL file.
You can read more about the functionality in my blogpost How To Stop Fighting AL and RDL(C): Rename Report columns Like a Pro.
7️⃣ Clean Up the Dataset Regularly
Reports love to accumulate unused fields over time.
If a field is:
- Not used in the layout
- Left over from experiments
- Only there “just in case”
…it probably shouldn’t be in your dataset.
AL Navigator can help identify and remove unused variables from both the AL code and the report dataset.
Your future self will thank you.
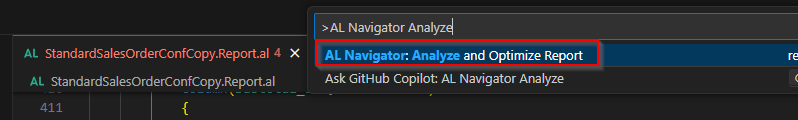
Use the command “AL Navigator Analyze and Optimize Report“
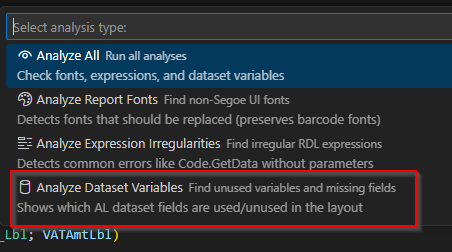
Select “Analyze Dataset Variables“
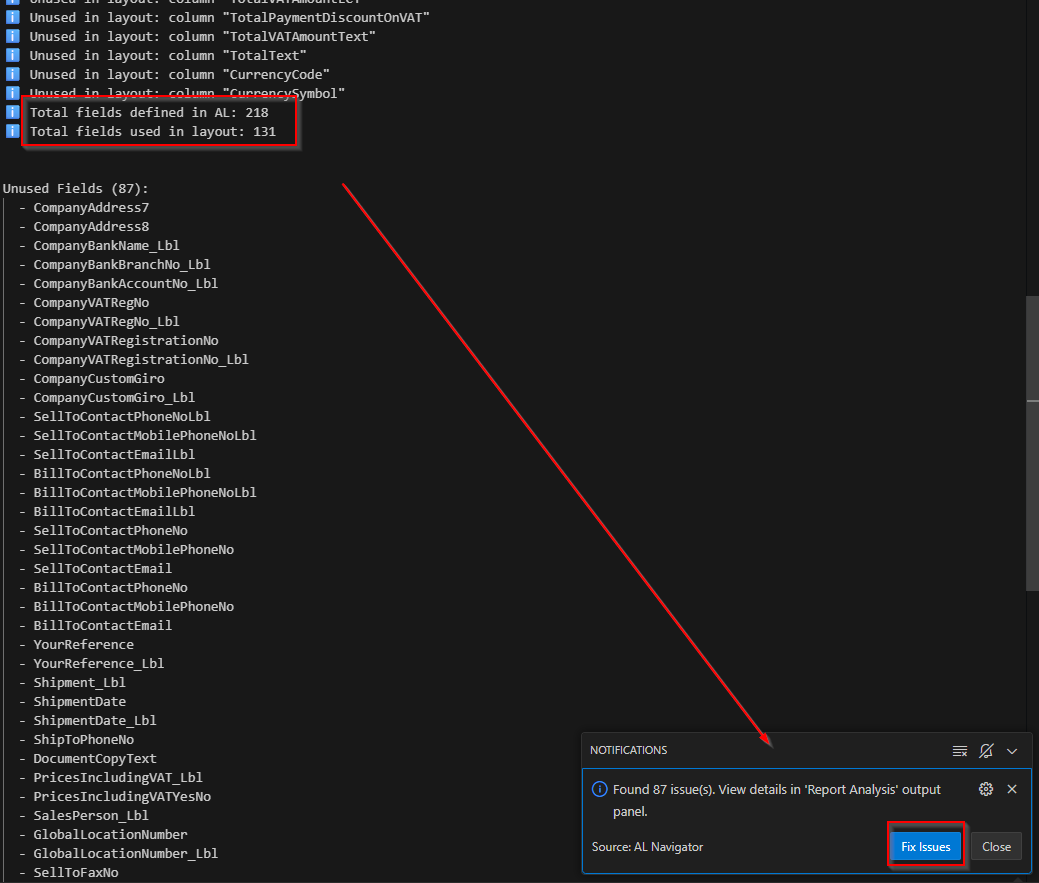
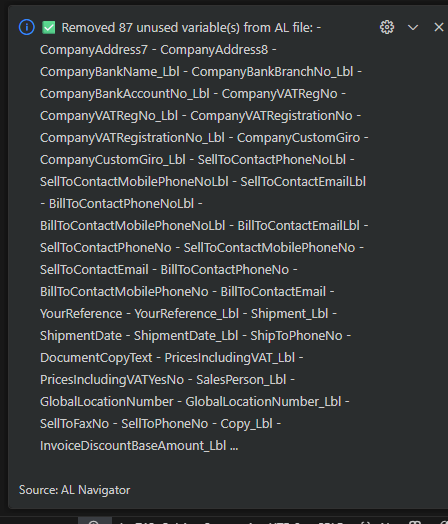
You will be presented with a report that shows you the issues of the report, in this case the variables that are definied in the dataset in AL but are never used in the corresponding RDL(C) layout. Click “Fix Issues” to remove these variables from the dataset.
8️⃣ Use Regions to Keep Large Reports Maintainable
As reports grow, structure becomes critical.
In the extension AL Toolbox by Bart Permentier you can find another gem – the command “ALTB: Create regions for AL dataitems and columns”.

After executing the command your DataItems and Columns are “wrapped” in regions. This has the advantage that you can expand and collapse your DataItems and Columns as you like. The more complex the report, the more useful this command is.
9️⃣ Preview Layouts Early and Often
This tip hasn’t aged at all since 2020.
Small dataset changes can have huge effects on the layout.
- Preview RDLC or Word layouts regularly
- Check grouping, totals, and visibility logic
- Don’t wait until “the end”
Frequent previews mean fewer unpleasant surprises.
🔟 Analyze and Optimize Report Fonts and Expression Irregularities
10.1 Analyze And Fix Report Fonts
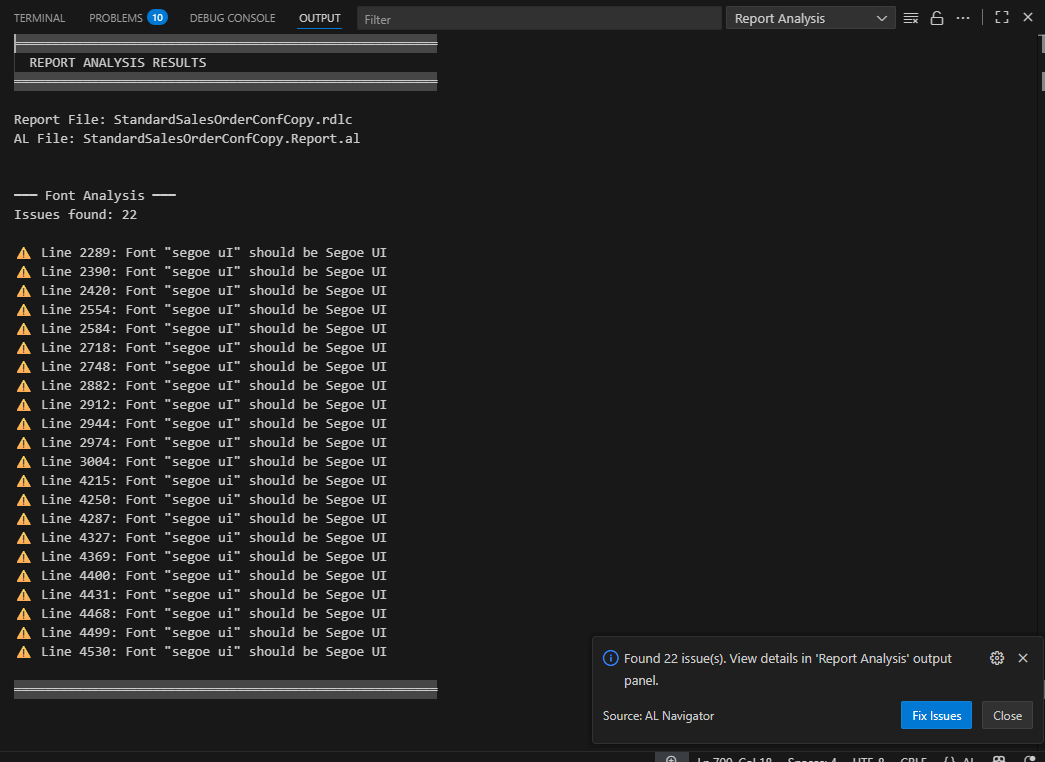
If you want to check if all of your elements in RDL(C) are using the right font family (Segoe UI), you can use the command “Analyze and Optimize Report“:
Select “Analyze Report Fonts“
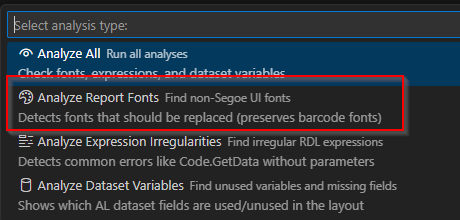
This will give you a detailled report and a possibility to fix the font families in the RDL(C) layout. Barcodes with a font family different than Segoe UI are of course not considered an issue.
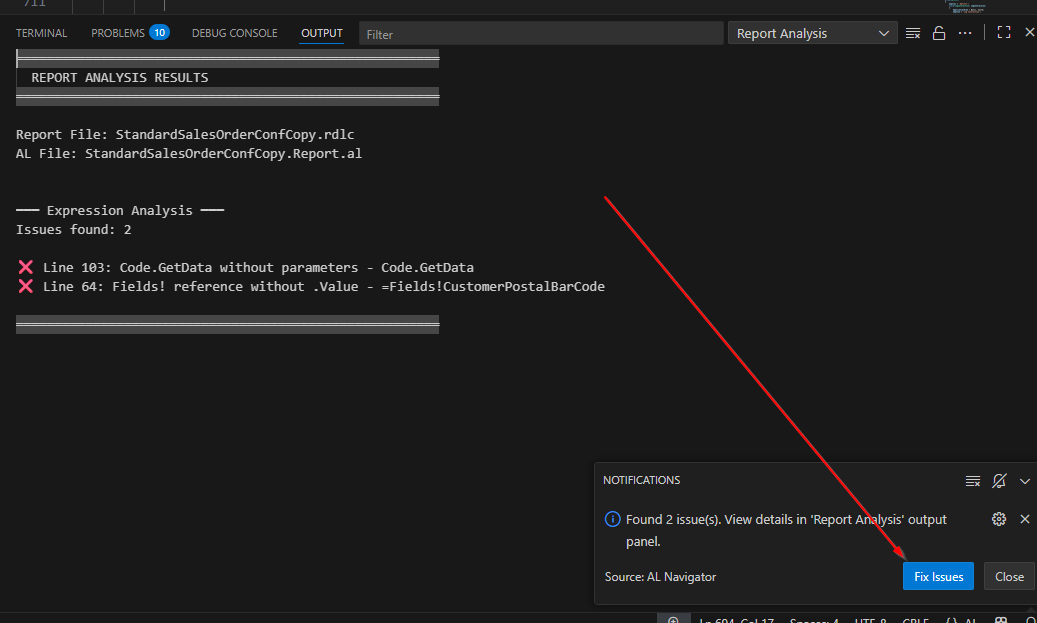
10.2 Analyze and Fix “Expression Irregularities”
Sometimes there is an error in the RLD(C) layout that is hard to spot and may only cause an error in runtime. Use the command “Analyze Expression Irregularities” to help you find and fix them.

Bonus Tip: Translate by using NAB AL Tools
It would be a bit too much to also explain this tool here, but if you want to translate your reports and don’t know how, read the documentation of the extension NAB AL Tools and use it, it can save you a lot of time!
Final Thoughts
Back in 2020, developing reports in AL often felt like navigating a maze without a map.
In 2025, with the right tools, it’s a completely different experience:
- Reports are easier to copy
- Code is easier to understand
- Datasets are easier to clean up
- Debugging is less painful
If you combine the different extensions, report development becomes faster, cleaner — and yes, sometimes even enjoyable 😄.
AL reports don’t have to be painful.
Likes
Reposts